


View From the Bench: Audio Level Meters
Meters are supposed to be the arbiters of truth, so why isn’t there just one standard?
By Andy Szikla
14 July 2018
It’s 1861, and James Clerk Maxwell (whose name now describes magnetic flux) and his chums take a break from zapping frogs’ legs, influencing Einstein, and shooting lightning between big Frankenstein Balls, to sit themselves down in front of the ancestor of all audio level meters — a galvanometer.
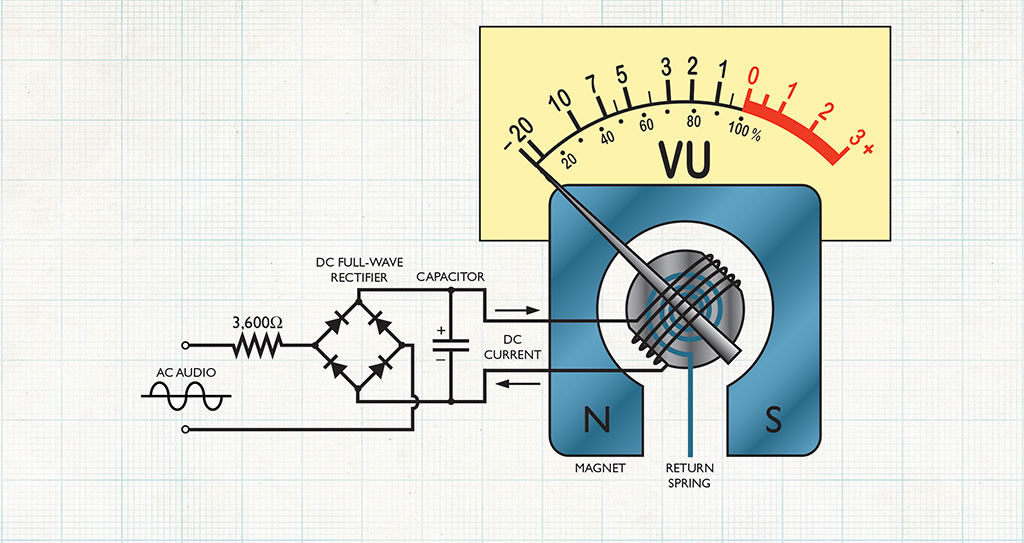
The British Association for the Advancement of Science has deputised them to come up with the first proper set of electrical units. Among his experiments, Maxwell measures grams of magnetic force produced by different quantities-per-second of electricity flowing through his galvanometer — exactly the same forces which cause deflection of the needle in a VU meter.
Maxwell’s definitions, published in 1863, are the roots from which more or less all of today’s electrical units stem, though not without occasionally branching off. Before long, Maxwell’s unit of resistance is thought too small, so it gets multiplied by a billion, and re-branded as the Ohm. Likewise, electromotive force is multiplied by one hundred million, and called a Volt. 20 years later the French not only stopped the British making the Volt and the Ohm 10 times bigger again, but also changed the name for current from the Weber to the Ampere. Sacré bleu! So it carried on for the next 100 years, with a network of tweaks and inconsistencies that can leave amateur historians out on a limb.
The truth is that while electricity is a force of nature, electronics is not. It is an industrial idea conceived to exploit those forces, by people whose job it is to make up new stuff as they go along. Pro audio is a side-branch of the electronics industry, and audio level meters are one of its many offshoots. Meters are a great metaphor for the development of electronics; they accommodate multiple interpretations and often deflect towards change despite wearing a facade of seemingly absolute values governed by a permanent order. In reality, that order has re-defined audio level meters many times — not only in terms of how they work, but also what information when you look at them.
In essence, audio level meters are visual indicators used to assess the amplitude of a signal, and to align signals passing between equipment. They provide information for an audio technician, but the exact nature of that information has never been completely agreed upon.
HIGH VOLUME DISTRIBUTION
Prior to 1920, audio level control was no more sophisticated than turning up the volume until you heard distortion, then backing it off a bit. This worked as long as the ins and outs weren’t too complicated; a single source into one amplifier.
On Armistice Day in 1921, a ceremony for the burial of the Unknown Soldier in Arlington Virginia was heard simultaneously on public address systems at Arlington, New York, and San Francisco, with high-bandwidth (16Hz~5kHz) telephone lines used as the distribution medium. Since too much level might cause overloading of the phone network amplifiers or ‘repeaters’, and the technician at Arlington couldn’t hear the P.A. in the other cities, the designers concluded that a separate means of input monitoring was required. Their solution was to create a device called a ‘Volume Indicator’, which consisted of a valve diode working into a DC milliamp meter. The amplification of the valve was adjustable so users could calibrate the needle’s deflection. Thereafter, an operator could keep tabs on audio levels without having to hear the result.
Moving needle meters quickly caught on, especially in helping prevent over-modulation of radio signals, and saturation of telephone repeater amplifiers, where headroom clipping could infect adjacent wires. The problem was: everyone had their own version! There were different schemes measuring peak or RMS voltage, with slow, medium or fast pointer speeds, system impedances based on either 500 or 600Ω, and reference levels set to 1, 6, 10, 12.5 or 50mW. Scales might indicate decibels from –20 to +6, or –10 to +3, or percentage saturation to 60%, or both, with zero usually calibrated at the mid deflection point. Confusion reigned, and if you had to connect one brand of equipment to another, good luck.
IN LOUD AGREEMENT
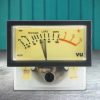
Common sense collided with history in 1940, when some guys from NBC, CBS, and Bell Telephone got together to agree on a new standard volume indicator and reference level, and what they invented was the VU meter as we know it today. Intended to display comparative loudness or power in ‘volume units’, their aim was to create a meter that would indicate identical levels for a range of dissimilar sources which an average listener would consider to be of equal loudness. They assembled focus groups and played them male speech, female speech, piano, brass band, dance orchestra, and violin recordings, asking them to pick the level for each one where the sound system appeared to be on the threshold of distortion. Since all of these sources contain different ratios of peak to overall RMS power, a peak-reading scheme was deemed undesirable.
RMS, or Root Mean Squared, is what you get when you take an undulating AC waveform and squish it into a flat block of equivalent density. Imagine the waves at the beach are peaking all over the place while you’re trying to work out the average depth of the tide. If you had a football-field sized piece of glass, you could squish the waves down until the sea is flat and then easily measure the volume of water. RMS tells you the power density under each wave, and the VU guys saw volume in a similar way. Their new meter would measure average power density against time. They chose 0.3 seconds as their preferred sample depth, rigging an internal capacitor to take that long to charge or discharge — a process governing each full-scale deflection and recovery. The slow timing was chosen partly because it would make a moving needle comfortable to read.
The VU meter was calibrated so that 0vu — aligning with ~71% deflection — would correspond to a level produced by 1mW of power in a 600Ω system. It was intended that its sensitivity might, via the addition of an external resistor, be easily adjusted to any standard reference level, say +4 or +8vu, or to indicate 100% modulation of a broadcast signal at whatever level that happens. Both uses were accommodated on the VU scale, marked in dB from –20 to +3vu, with the 100% mark aligned with 0vu.
STANDARD ISSUE
The 0vu standard was overwhelmingly accepted in all corners of industry, and later referred to as 0dBm (dB milliwatts). A 1mW sine wave into a 600Ω load produces a level of 0.775vrms, and today we disregard the load and just call the voltage level 0dBu. The ‘u’ originally meant ‘unloaded’ (ie. we don’t care what the load is, only the voltage level) but that’s all so long ago, now we simply regard dBu as dB ‘units’.
Some other people decided they didn’t like a zero reference of 0.7745966692… volts RMS, and upped it to 1 Volt even, calling it 0dBV. Today our domestic hi-fi gear uses –10dBV as its 0vu reference point (around –8dBu), whereas most professional systems use +4dBu, and some gadgets give you the choice of both.
SCALING THE EUROPEAN PEAKS
By 1950, the dBm was a smash hit world-wide, but the VU meter was not so successful outside the USA. Those pesky Europeans were less interested in subjective comparisons of sound sources, and more interested in knowing exactly how signals were being handled by actual equipment. In Germany, Scandinavia, and England, engineers had been separately developing peak level meters with the principal aim of monitoring broadcast modulation. Nobody saw the benefit in using an RMS-type device to do this monitoring, since it is the program peaks which cause over-modulation. Engineers at the BBC were even unkind enough to refer to the VU meter as the ‘Virtually Useless’ meter.
Peak-reading meters were around before VU, but to this day there has never been a single standard scale, timing or reference level to which all Peak Program Meters (PPM) abide. However, they do all calibrate to so many dBu, and to the naked eye all appear to sort of behave the same way-ish, with fast attack times (to catch the peaks) and usually a slow decay. In the days of analogue valves, overloading produced distortion that was not terribly harsh, and the feeling was if it lasted less than a few milliseconds nobody would notice. A milliamp meter could deflect to full scale in 1mS, so it became standard practice to slow down the attack slightly to remove these aurally meaningless peaks — the Brits chose 4mS and the Germans 10mS. With today’s digital equipment, hitting full-scale makes a loud bang, so quicker attack times can be useful.
PPM decay might last anything from 1.5 (EBU) to 2.5 (BBC) seconds, mainly to make things easy on the eye. In time, it became fashionable to include a peak-hold of between one and three seconds, which is helpful if you have to look away momentarily, and don’t want to miss what happened.
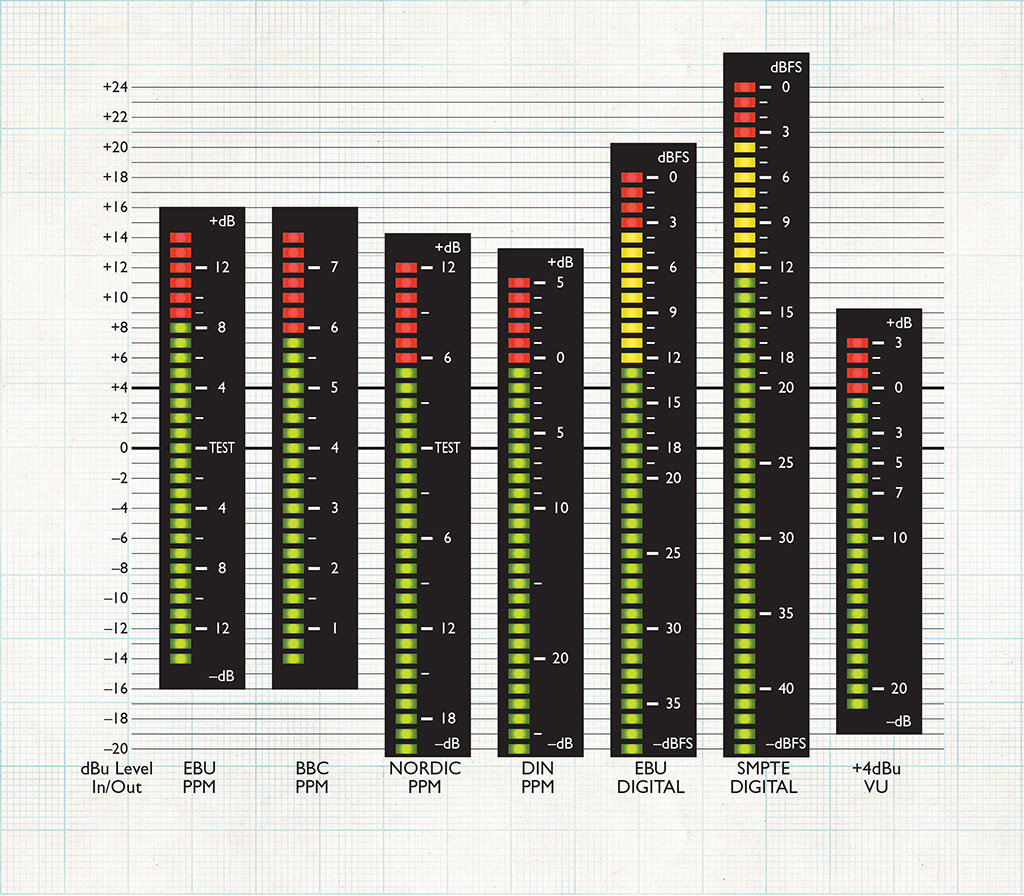
The front panel scales and alignments, however, are largely dreamt up. The BBC used a scale which was simply numbered one to seven, where four corresponded to 0dBu, and six to their maximum permitted signal of +8dBu. The EBU scale was marked in dB from –12 to +12dBu, with 0dBu marked as ‘Test’. There were many others — Diagram 2 provides a taste.
RE-BUILT FROM THE TOP-DOWN
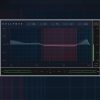
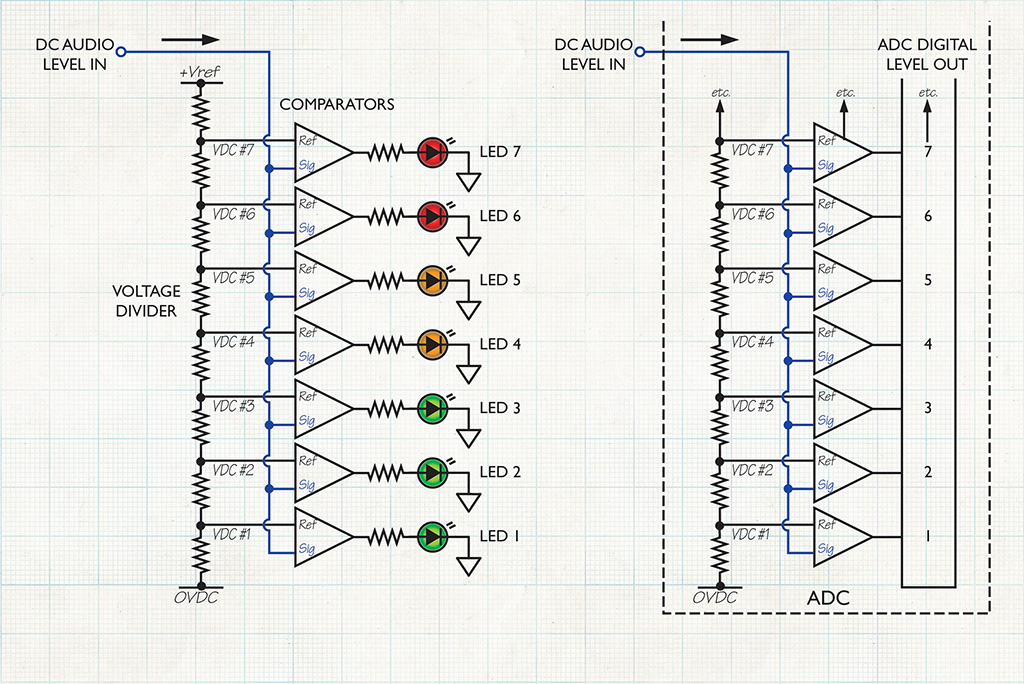
Today with digital audio, it is very important to avoid 100% bit saturation of the digital converter. The kind of scale we’re most used to refers to that point as 0dBFS, or 0dB Full Scale, and proceeds downward in negative decibels. The point at which any analogue ins or outs on a digital device agree with 0dBu could be –24, –20, –18, –12dBFS, or any other figure that takes the fancy of the manufacturer who’s gear you are using. Again, there is no single universal standard. On stand-alone devices a dBFS meter is likely to be constructed using LEDs, as opposed to a moving needle, but on more complex equipment will probably occupy part of a graphical display.
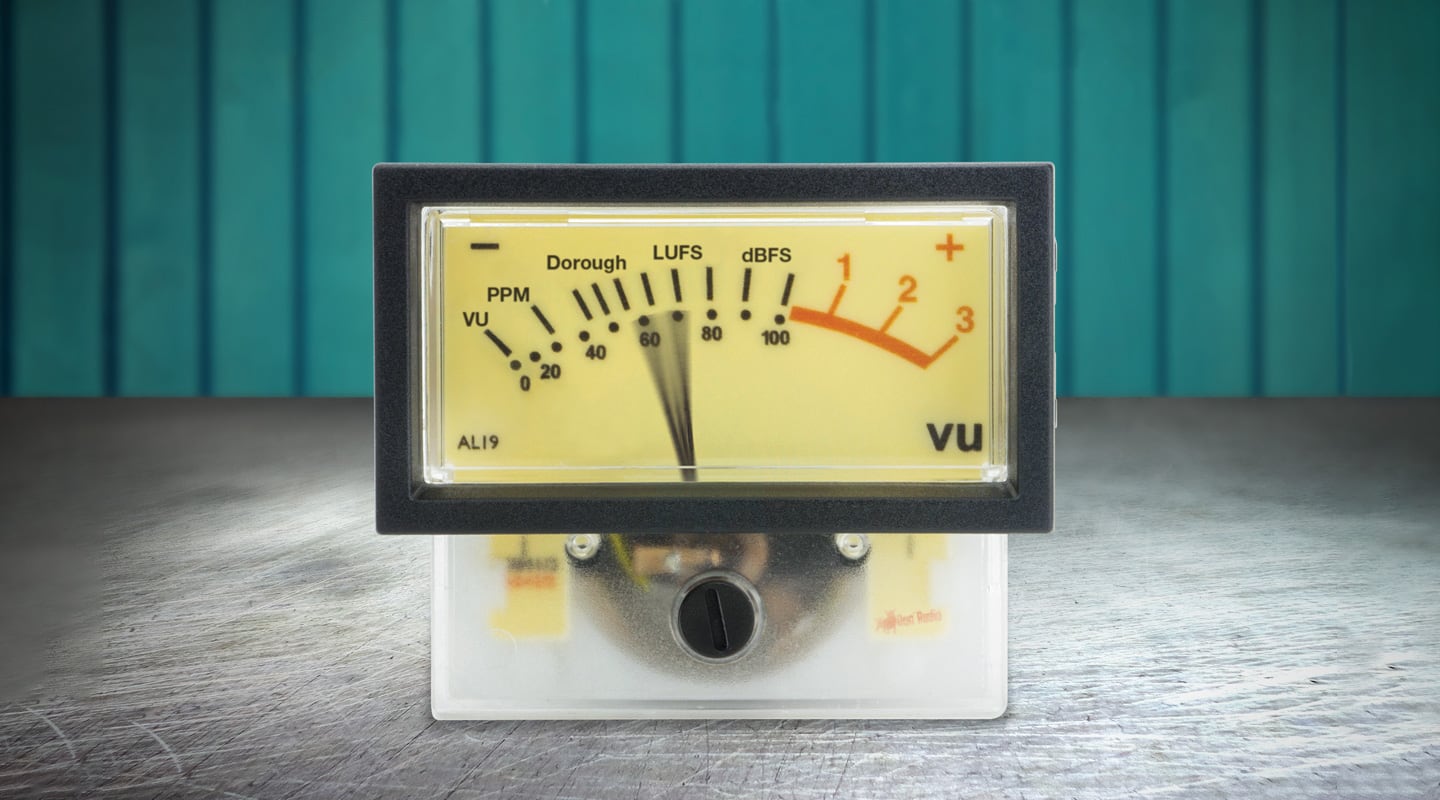
Some meters now display both VU and PPM simultaneously, with VU expressed as a solid bar, and PPM as a moving dot above it. Such schemes were proposed as far back as 1981 by Michael Dorrough of Dorrough Electronics, who has since gone on to invent a new type of ballistic which he calls the ‘Loudness Meter’, or LUFS (Loudness Units Full Scale).
Why not create a new meter? If anything is clear from all of the above it is that anybody who ever created a meter scheme was really just interested in getting some visual assistance to see what was happening to the signal, or the equipment. There’s nothing intrinsically empirical about any of the PPM schemes; people just decided to do things a certain way. If it helps an audio engineer perform their job well, there is nothing to stop you, me, or Mrs Tech Bench meddling with timing and alignment, or applying new wacky algorithms to create any kind of meter we want.
Who knows — if we come up with a good one, it might catch on.


RESPONSES